Higher CGM average means lower insulin sensitivity.
Conceptually, among otherwise similar non-diabetic people:
- CGM mean ~90 mg/dL would generally be more consistent with better insulin sensitivity.
- CGM mean ~105–110 mg/dL may indicate poorer insulin sensitivity / greater compensatory insulin secretion.
- The paper does not establish diagnostic cutoffs at those values.
https://pubmed.ncbi.nlm.nih.gov/41418028
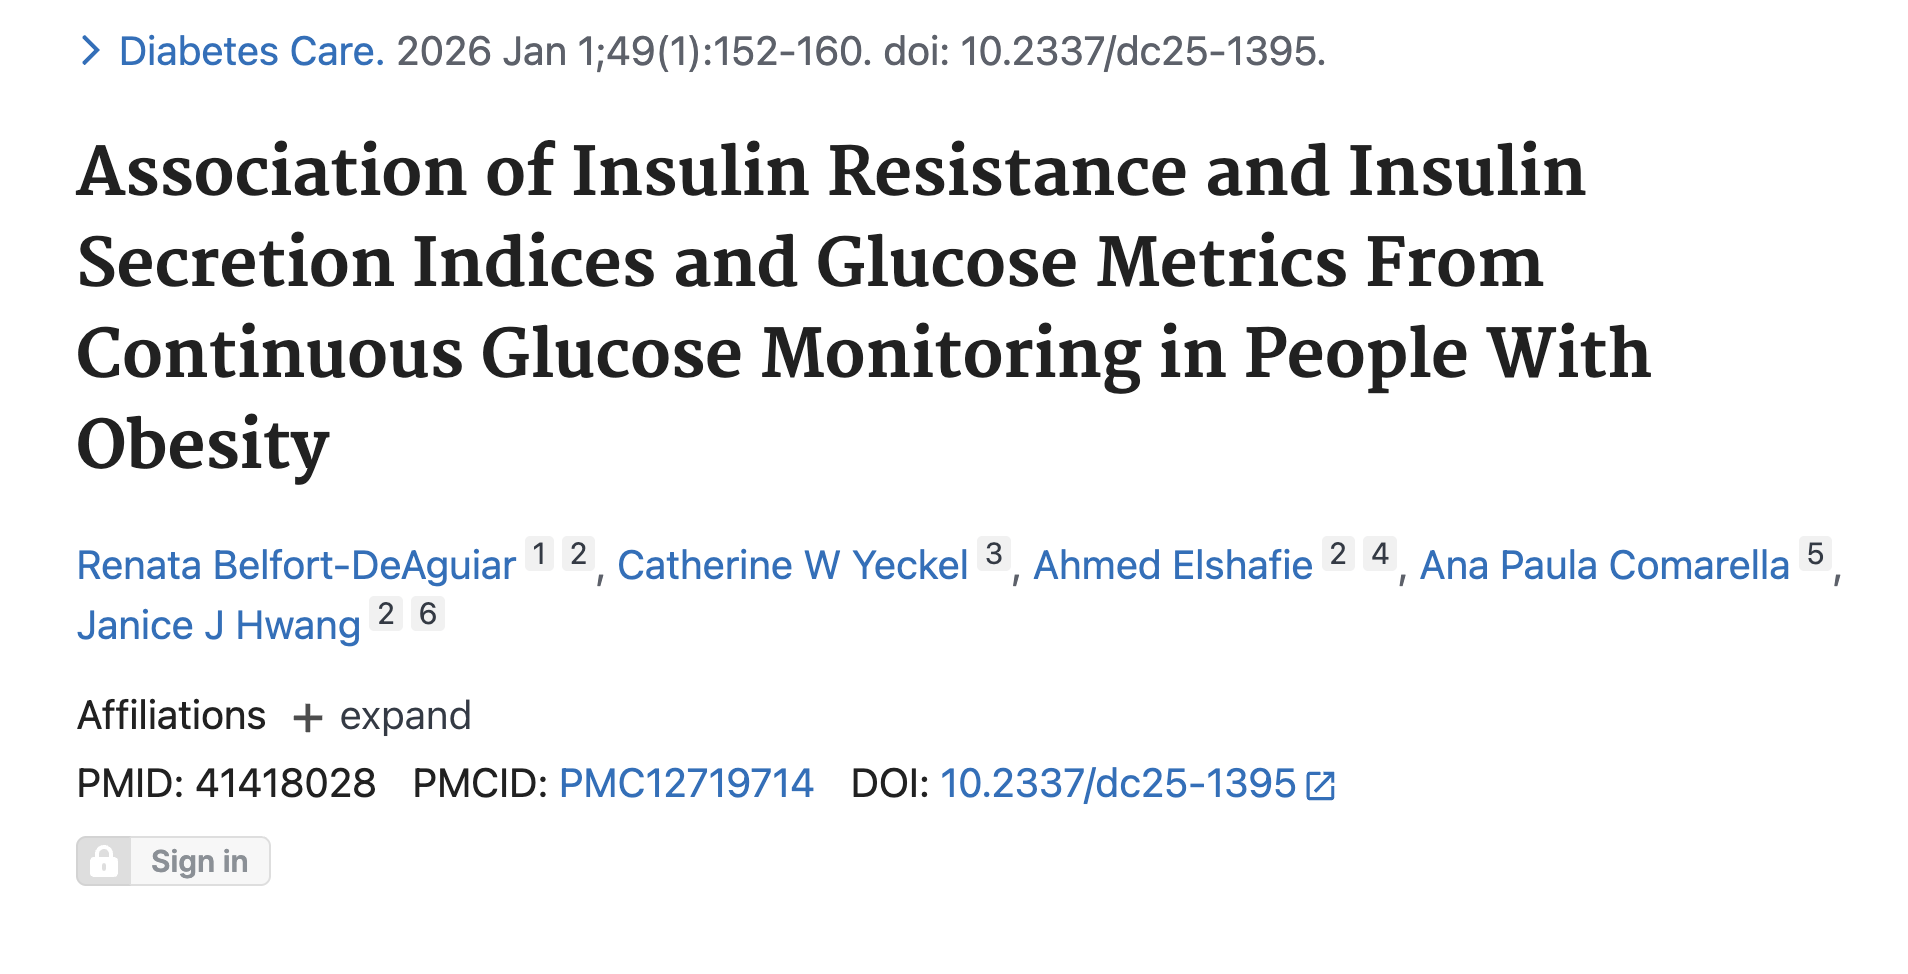
Association of Insulin Resistance and Insulin Secretion Indices and Glucose Metrics From Continuous Glucose Monitoring in People With Obesity
Renata Belfort-DeAguiar 1 2, Catherine W Yeckel 3, Ahmed Elshafie 2 4, Ana Paula Comarella 5, Janice J Hwang 2 6
Affiliations Expand
- PMID: 41418028
- PMCID: PMC12719714
- DOI: 10.2337/dc25-1395
Abstract
Objective: To investigate the relationship between free-living glucose metrics obtained with continuous glucose monitoring (CGM) and validated indices of insulin resistance and insulin secretion in individuals with obesity: OB(+T2D) or OB(-T2D) for with and without type 2 diabetes, respectively.
Research design and methods: Thirty-seven individuals (17 OB(+T2D) and 20 OB(-T2D) wore a CGM device and had a 2-h oral glucose tolerance test (OGTT). Of these, 27 also underwent a two-step hyperglycemic-euglycemic clamp. CGM metrics calculated with EasyGV software were correlated with indices of insulin secretion and insulin resistance from OGTT and clamp.
Results: CGM metrics, such as mean and glycemic variability indices, were higher in OB(+T2D) than in OB(-T2D) (P < 0.001). CGM mean inversely correlated with insulin resistance indices (insulin sensitivity index from OGTT and glucose infusion rate [GIR] from the clamp) when analyzing all participants together (GIR: r = -0.82, P < 0.001) or separately (P < 0.01). CGM mean negatively correlated with insulin secretion indices only when the two groups were analyzed together (P < 0.05). When analyzing each group separately, CGM mean positively correlated with insulin levels during the OGTT and hyperglycemic step of the clamp in the OB(-T2D), but not the OB(+T2) group.
Conclusions: Our findings suggest that CGM metrics, in particular, the simplest metric, CGM mean, was associated with the degree of insulin resistance. Further research is needed to determine whether CGM mean could be a tool to identify normal glucose-tolerant individuals with obesity potentially at risk for progressing to prediabetes and diabetes, and whether its convergence with increased glycemic variability can further contribute to risk prediction of glycemic disorders.
© 2025 by the American Diabetes Association.
Conflict of interest statement
Duality of Interest. No potential conflicts of interest relevant to this article were reported.
Figures


Similar articles
- Surrogate estimates of insulin sensitivity in obese youth along the spectrum of glucose tolerance from normal to prediabetes to diabetes.George L, Bacha F, Lee S, Tfayli H, Andreatta E, Arslanian S.J Clin Endocrinol Metab. 2011 Jul;96(7):2136-45. doi: 10.1210/jc.2010-2813. Epub 2011 Apr 20.PMID: 21508130Free PMC article.
- Insulin secretion in normal glucose-tolerant relatives of type 2 diabetic subjects. Assessments using hyperglycemic glucose clamps and oral glucose tolerance tests.van Haeften TW, Dubbeldam S, Zonderland ML, Erkelens DW.Diabetes Care. 1998 Feb;21(2):278-82. doi: 10.2337/diacare.21.2.278.PMID: 9539996
- Clinical factors associated with absolute and relative measures of glycemic variability determined by continuous glucose monitoring: an analysis of 480 subjects.Jin SM, Kim TH, Bae JC, Hur KY, Lee MS, Lee MK, Kim JH.Diabetes Res Clin Pract. 2014 May;104(2):266-72. doi: 10.1016/j.diabres.2014.02.003. Epub 2014 Feb 22.PMID: 24630619
- Patient-accessible continuous glucose monitoring for cardiometabolic risk reduction in type 2 diabetes: A meta-analysis of randomized controlled trials.Sebastian SA, Padda I, Bimal T, Varma S, Collins J, Ahmad Z, Safarova MS.Dis Mon. 2026 Mar;72(3):102043. doi: 10.1016/j.disamonth.2025.102043. Epub 2025 Nov 26.PMID: 41309353
- [Preexisting diabetes: Expert consensus from the College of French Gynecologists and Obstetricians and from the French Society of Diabetology].Garabedian C, Sénat MV, Sananès N, Berveiller P, Brillac T, Le Lous M, Lemaître M, Mitanchez D, Morel O, Paquin S, Rigouzzo A, Rimareix F, Simon L, Tatulashvili S, Sibiude J, Vambergue A.Gynecol Obstet Fertil Senol. 2026 Mar;54(3):132-164. doi: 10.1016/j.gofs.2025.12.001. Epub 2025 Dec 7.PMID: 41365423French.
References
- Cameron NA, Petito LC, McCabe M, et al. Quantifying the sex-race/ethnicity-specific burden of obesity on incident diabetes mellitus in the United States, 2001 to 2016: MESA and NHANES. J Am Heart Assoc 2021;10:e018799. – PMC – PubMed
- Defronzo RA. Banting Lecture. From the triumvirate to the ominous octet: a new paradigm for the treatment of type 2 diabetes mellitus. Diabetes 2009;58:773–795 – PMC – PubMed
- Polonsky KS, Given BD, Van Cauter E. Twenty-four-hour profiles and pulsatile patterns of insulin secretion in normal and obese subjects. J Clin Invest 1988;81:442–448 – PMC – PubMed


Leave a comment